作者:小小明
在一堆基站经纬度数据中,时常涉及三种计算,例如查找某个点最近的N个点,查找某个点指定距离范围内的所有点,将距离小于指定阈值聚类的基站聚类在一起。
下面我们看看计算方法。
import pandas as pd
import matplotlib.pyplot as plt
%matplotlib inline
plt.rcParams['font.sans-serif'] = ['SimHei']
plt.rcParams['axes.unicode_minus'] = False
首先读取数据集:
excel = pd.io.excel.ExcelFile("point.xlsx")
find = excel.parse("查找")
data = excel.parse("数据库")
# 去除重复数据
find.drop_duplicates(ignore_index=True, inplace=True)
data.drop_duplicates(ignore_index=True, inplace=True)
data.reset_index(drop=False, inplace=True)
print("被查找的点:", find.shape)
display(find.head())
print("经纬度数据库:", data.shape)
display(data.head())
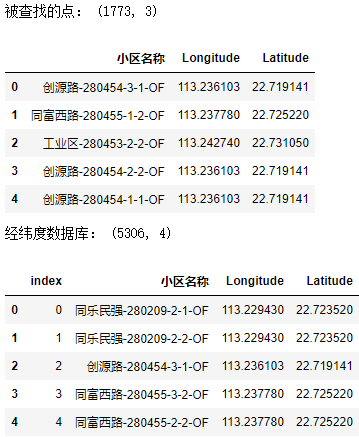
数据预处理
为了后续计算方便,我们可以将被被查找表对应到经纬度数据库的索引保存起来:
data.rename(columns={"index": "索引"}, inplace=True)
find = pd.merge(find, data, how="left")
find.head()
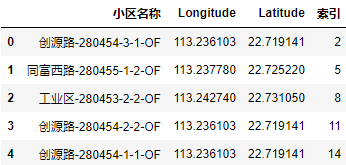
计算被查找的点是否不在数据库中:
find.query("索引.isnull()", engine="python").shape[0]
返回0,说明所有被查找的坐标点都在数据库内。
为了后续计算方便,我们可以将被被查找表的索引对应到经纬度数据库:
find.index = data.index[data.小区名称.isin(find.小区名称)]
find
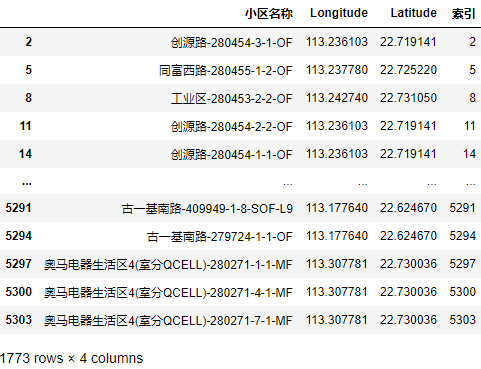
将坐标信息可视化一下,看一下整体分布:
plt.figure(dpi=200)
plt.scatter(data.Longitude,  data.Latitude, s=10, color='blue', alpha=0.1)
plt.scatter(find.Longitude, find.Latitude, s=1, color='red', alpha=0.1)
plt.show()
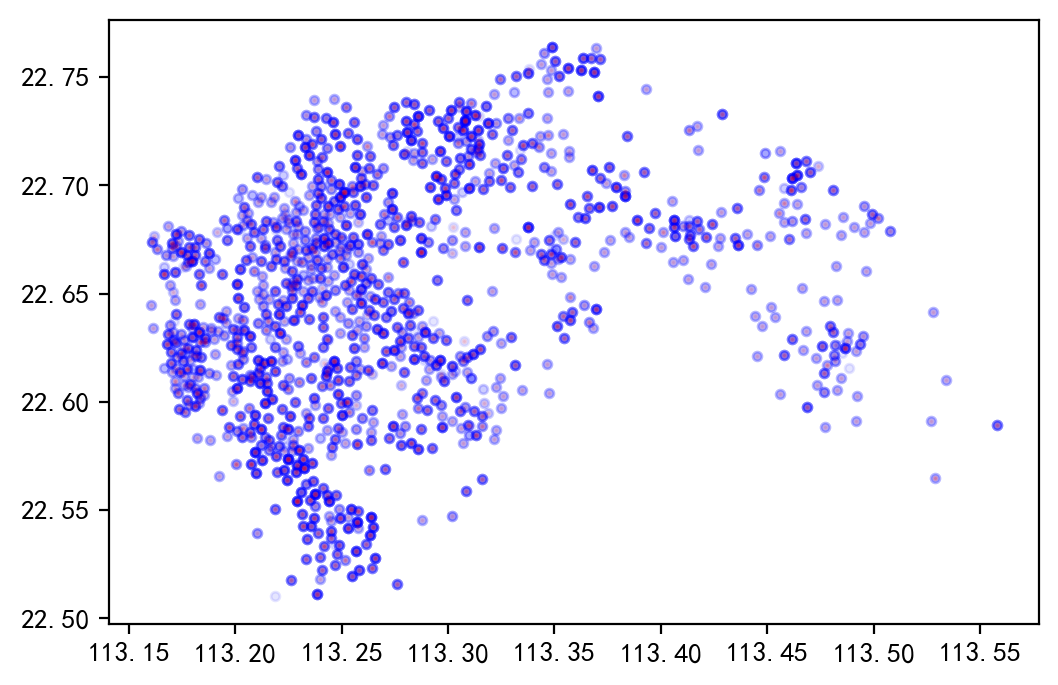
从图中的颜色深浅可以看到很多点的位置几乎相同,导致颜色叠加的比较深。
下面首先我们来计算一下每个点最近的N个点:
查找每个点最近的N个点
首先提取经纬度数据转成numpy数组:
data_p = data.values[:, 2:4]
find_p = find.values[:, 1:3]
print(data_p.shape, find_p.shape)
(5306, 2) (1773, 2)
创建用于计算两个经纬度距离的函数:
from math import *


def distancefuc(s1, s2):
    "创建用于计算两个经纬度距离的函数"
    # 经纬度转换成弧度
    lon1, lat1 = map(radians, s1)
    lon2, lat2 = map(radians, s2)
    dlon = lon2 - lon1
    dlat = lat2 - lat1
    a = sin(dlat / 2)**2 + cos(lat1) * cos(lat2) * sin(dlon / 2)**2
    distance = round(2 * asin(sqrt(a)) * 6371000, 1)  # 地球平均半径,6371km
    return distance
可以使用已经封装好的NearestNeighbors创建BallTree模型:
from sklearn.neighbors import NearestNeighbors

nn = NearestNeighbors(metric=distancefuc, algorithm='ball_tree')
nn.fit(data_p)
但我们直接使用内层BallTree类,因为API更加简单直接:
from sklearn.neighbors import BallTree
bt = BallTree(data_p, metric=distancefuc)
由于每个被查找点都存在于数据库中,所以必然找出的n个点会包含自身,但我们可以先找出最近的n+1个点,再去掉自身。
比如我们想找出每个点最近的10个点,可以先找出最近的11个点:
# 结果与nn.kneighbors(find_p, 11, return_distance=True)一样
distances, points = bt.query(find_p, 11, return_distance=True)
print(distances[:1])
print(points[:1])
[[  0.    0.    0.    0.    0.    0.  364.7 364.7 364.7 364.7 364.7]]
[[  11   15   13   12    2   14   17 4065   18   20 4067]]
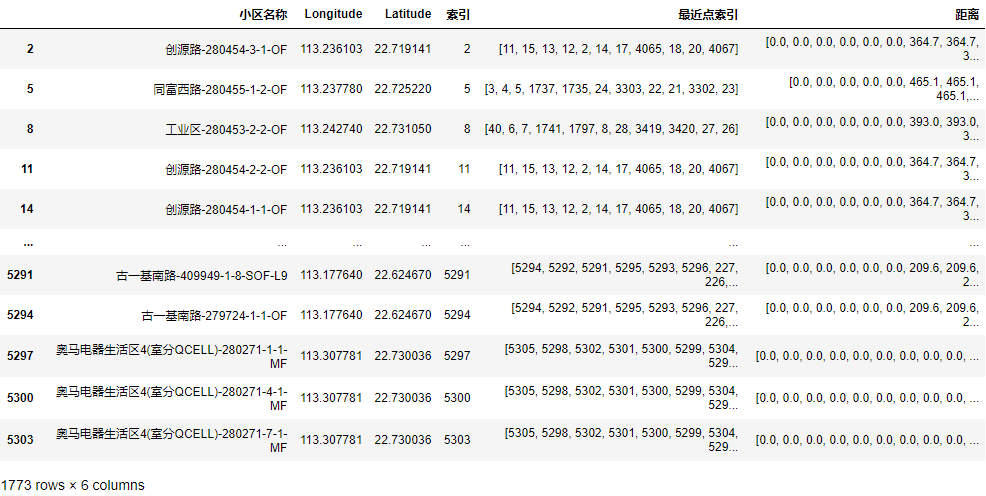
下面我们首先将结果整合到表格中:
find["最近点索引"] = points.tolist()
find["距离"] = distances.tolist()
find
可视化检查BallTree查找效果
查看可用的颜色表:
plt.colormaps()
对于连续性colormap可以通过以下方法获取颜色值,可自由设置颜色个数:
cm = plt.get_cmap('gist_rainbow')
NUM_COLORS = 22
colors = [cm(1.*i/NUM_COLORS) for i in range(NUM_COLORS)]
对于离散颜色值使用以下命令获取颜色列表:
colors = plt.get_cmap('tab20b').colors
下面我们随机找20个点,并用不同的颜色可视化每个点最近的10个点:
plt.figure(figsize=(18, 8), dpi=100)
plt.scatter(data.Longitude,  data.Latitude, s=20, color='black', alpha=0.1)
for c, p in zip(plt.get_cmap('tab20b').colors, find.sample(20).最近点索引.values):
    plt.scatter(data.loc[p].values[:, 2],
                data.loc[p].values[:, 3], s=50, color=c, alpha=1)
plt.show()
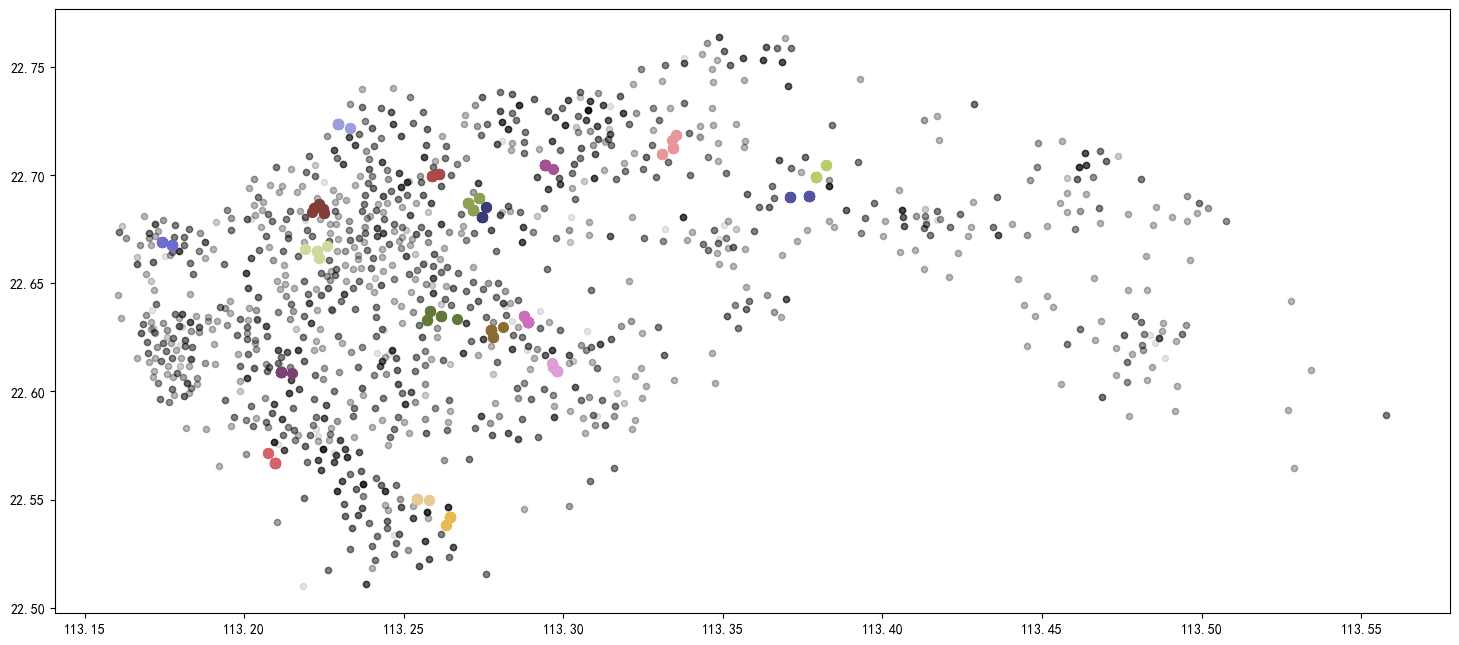
可以看到颜色相近的正好在一起。
为了更清晰的看到效果,我们将其显示到folium地图上。
首先定义颜色值列表:
colors = ['cyan', 'lightblue', 'rosybrown', 'seagreen', 'sandybrown', 'salmon', 'silver', 'darkmagenta', 'darkorchid', 'honeydew',
          'cadetblue', 'thistle', 'blue', 'palegoldenrod', 'cornflowerblue', 'lightseagreen', 'hotpink', 'gainsboro', 'aqua',
          'lavender', 'darkturquoise', 'lightgray', 'lemonchiffon', 'cornsilk', 'chocolate', 'saddlebrown', 'darkolivegreen',
          'beige', 'tomato', 'darkslateblue', 'darkorange', 'mediumseagreen', 'orchid', 'chartreuse', 'darkblue', 'indianred',
          'lightsteelblue', 'navy', 'coral', 'limegreen', 'lime', 'sienna', 'deeppink', 'pink', 'gold', 'greenyellow', 'mediumorchid',
          'crimson', 'mediumslateblue', 'aquamarine', 'plum', 'lightcoral', 'orange', 'lightsalmon', 'papayawhip', 'lightgoldenrodyellow',
          'snow', 'olive', 'red', 'burlywood', 'mediumblue', 'darkcyan', 'skyblue', 'indigo', 'powderblue', 'darkgoldenrod', 'gray',
          'oldlace', 'darkgray', 'blueviolet', 'royalblue', 'khaki', 'darkgreen', 'palegreen', 'dimgray', 'floralwhite', 'firebrick',
          'navajowhite', 'mediumpurple', 'steelblue', 'lightcyan', 'ghostwhite', 'lightpink', 'bisque', 'whitesmoke', 'mediumturquoise',
          'fuchsia', 'ivory', 'slategray', 'darkviolet', 'deepskyblue', 'seashell', 'mintcream', 'forestgreen', 'mediumspringgreen',
          'azure', 'teal', 'green', 'wheat', 'lawngreen', 'lavenderblush', 'yellow', 'slateblue', 'peachpuff', 'mediumvioletred',
          'violet', 'peru', 'white', 'orangered', 'lightskyblue', 'darkred', 'aliceblue', 'blanchedalmond', 'mistyrose', 'linen',
          'yellowgreen', 'antiquewhite', 'springgreen', 'darkseagreen', 'lightgreen', 'lightslategray', 'goldenrod', 'paleturquoise',
          'purple', 'magenta', 'turquoise', 'black', 'tan', 'mediumaquamarine', 'dodgerblue', 'midnightblue', 'palevioletred',
          'darkslategray', 'lightyellow', 'maroon', 'brown', 'moccasin', 'olivedrab', 'darksalmon', 'darkkhaki']
folium地图可视化展示
使用pip安装folium后可以直接使用:
import folium
import itertools
from folium import plugins
m = folium.Map(location=[data.Latitude.median(), data.Longitude.median()],
zoom_start=12, zoom_control='False', control_scale=True,
tiles='http://webrd02.is.autonavi.com/appmaptile?lang=zh_cn&size=1&scale=1&style=8&x={x}&y={y}&z={z}',
attr='© <a href="http://ditu.amap.com/">高德地图</a>'
)
# 为地图对象添加点击显示经纬度的子功能
# m = m.add_child(folium.LatLngPopup())
incidents = folium.map.FeatureGroup()
for p in data.values[:, [3, 2]]:
incidents.add_child(
folium.CircleMarker( # CircleMarker表示画圆
p.tolist(), # 坐标
radius=1, # 圆圈半径
color='gray', # 标志的外圈颜色
)
)
colors_iter = iter(colors)
for name1, y1, x1, i, ps, ds in find.sample(140).values:
color = next(colors_iter)
for p, d in zip(ps, ds):
j, name2, y2, x2 = data.loc[p]
folium.PolyLine(locations=[(x1, y1), (x2, y2)], color=color).add_to(m)
incidents.add_child(
folium.Circle( # CircleMarker表示画圆
(x2, y2), # 坐标
radius=50, # 圆圈半径
color='blue', # 标志的外圈颜色
tooltip=f"{name2}\n距离\n{name1}\n{d:.2f}米",
fill=True, # 是否填充
fill_color='blue', # 填充颜色
fill_opacity=0.05 # 填充透明度
)
)
incidents.add_child(
folium.CircleMarker( # CircleMarker表示画圆
(x1, y1), # 坐标
radius=1, # 圆圈半径
color='red', # 标志的外圈颜色
tooltip=name1,
)
)
m.add_child(incidents)
m
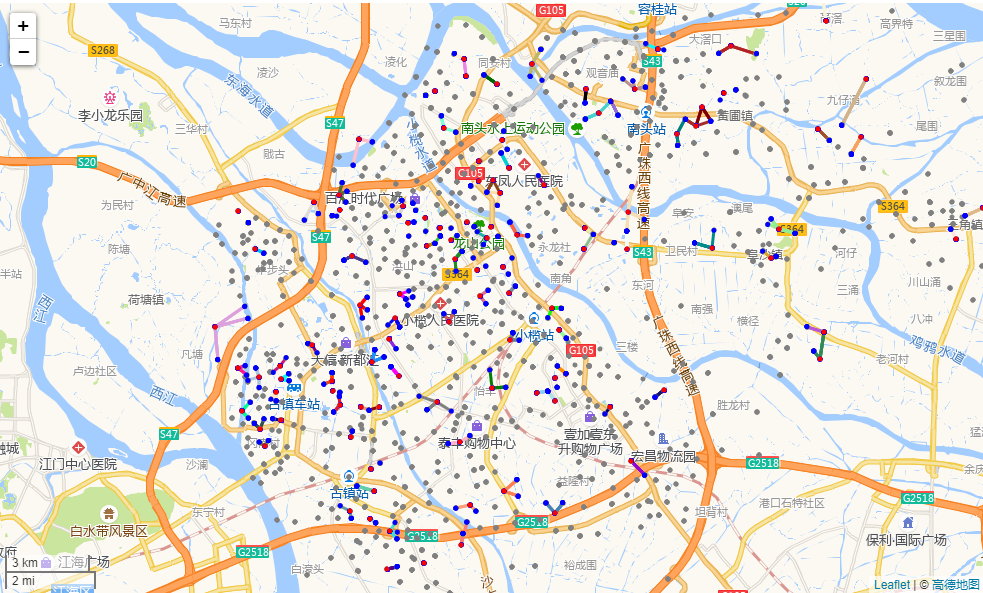
上面是随机选取140个点的地图可视化效果,地图可以任意放大缩小。
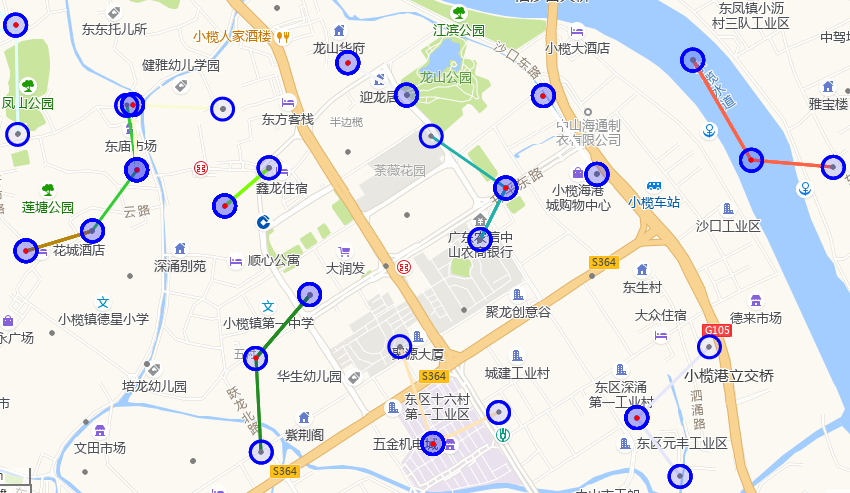
这是放大后,一些点的可视化效果。
图中红色点表示从被查找点随机选取的140个点,每个红色点与找到的最近10个点会有一个连线,终点会画一个50米的圆,根据填充色的颜色深度可以知道当前点与其他点的重合程度,与其重合的点越多颜色越深。
结果整理
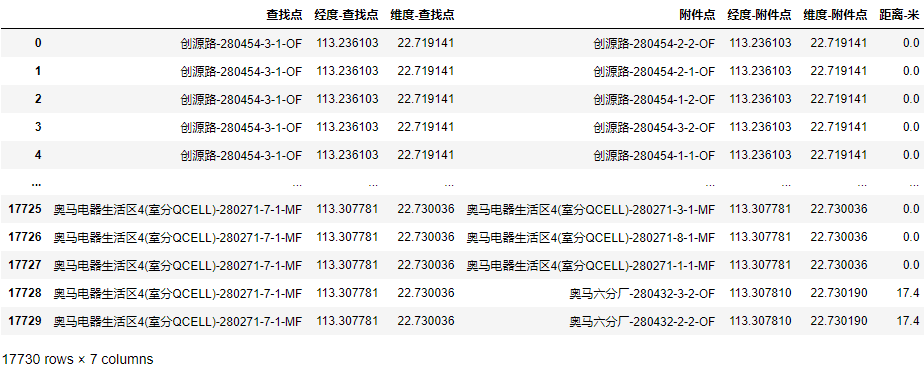
下面我们将查找到的结果组织成每行如下列的格式:
- 查找点
- 经度-查找点
- 维度-查找点
- 附件点
- 经度-附件点
- 维度-附件点
- 距离-米
实际测试中发现,当找到距离等于0的点超过10个时,也可能不包含自身,所以发现不包含自身时也需要删除:
result = []
for name1, y1, x1, i, ps, ds in find.values:
    try:
        idx = ps.index(i)
    except ValueError:
        idx = -1
    if idx > 0 or len(ps) > 10:
        ps.pop(idx)
        ds.pop(idx)
    for p, d in zip(ps, ds):
        name2, y2, x2 = data.loc[p].values[1:4]
        result.append((name1, y1, x1, name2, y2, x2, d))
result = pd.DataFrame(result, columns=["查找点", "经度-查找点",
                                       "维度-查找点", "附件点", "经度-附件点", "维度-附件点", "距离-米"])
result
纯数据处理的整体代码
from sklearn.neighbors import BallTree
from math import *
import pandas as pd

# 数据预处理
excel = pd.io.excel.ExcelFile("point.xlsx")
find = excel.parse("查找")
data = excel.parse("数据库")
# 去除重复数据
find.drop_duplicates(ignore_index=True, inplace=True)
data.drop_duplicates(ignore_index=True, inplace=True)
data.reset_index(drop=False, inplace=True)

data.rename(columns={"index": "索引"}, inplace=True)
find = pd.merge(find, data, how="left")
find.index = data.index[data.小区名称.isin(find.小区名称)]
data_p = data.values[:, 2:4]
find_p = find.values[:, 1:3]


def distancefuc(s1, s2):
    "创建用于计算两个经纬度距离的函数"
    # 经纬度转换成弧度
    lon1, lat1 = map(radians, s1)
    lon2, lat2 = map(radians, s2)
    dlon = lon2 - lon1
    dlat = lat2 - lat1
    a = sin(dlat / 2)**2 + cos(lat1) * cos(lat2) * sin(dlon / 2)**2
    distance = round(2 * asin(sqrt(a)) * 6371000, 1)  # 地球平均半径,6371km
    return distance


bt = BallTree(data_p, metric=distancefuc)
distances, points = bt.query(find_p, 11, return_distance=True)
find["最近点索引"] = points.tolist()
find["距离"] = distances.tolist()
result = []
for name1, y1, x1, i, ps, ds in find.values:
    try:
        idx = ps.index(i)
    except ValueError:
        idx = -1
    if idx > 0 or len(ps) > 10:
        ps.pop(idx)
        ds.pop(idx)
    for p, d in zip(ps, ds):
        name2, y2, x2 = data.loc[p].values[1:4]
        result.append((name1, y1, x1, name2, y2, x2, d))
result = pd.DataFrame(result, columns=["查找点", "经度-查找点",
                                       "维度-查找点", "附件点", "经度-附件点", "维度-附件点", "距离-米"])
至此我们就完成了最近N个点的查找。
下面我们再继续演示需求2:
查找每个点N米范围内的所有点
前面我们已经创建了BallTree模型,并加载了经纬度数据库数据,直接使用前面创建的模型即可。
例如我们要查找半径500米范围内的点:
# 与distances, points = nn.radius_neighbors(find_p, 500, return_distance=True)结果一样
points, distances = bt.query_radius(find_p, 500, return_distance=True)
print(distances[:1])
print(points[:1])
[array([364.7, 364.7, 364.7, 364.7, 364.7, 364.7, 364.7, 364.7, 364.7,
          0. ,   0. ,   0. ,   0. ,   0. , 414.1, 414.1, 414.1, 414.1,
          0. ])                                                       ]
[array([  20, 4065,   18, 1355, 4066,   16,   17, 4067,   19,   12,    2,
          13,   11,   15, 1363,   34,   35,   36,   14], dtype=int64)    ]
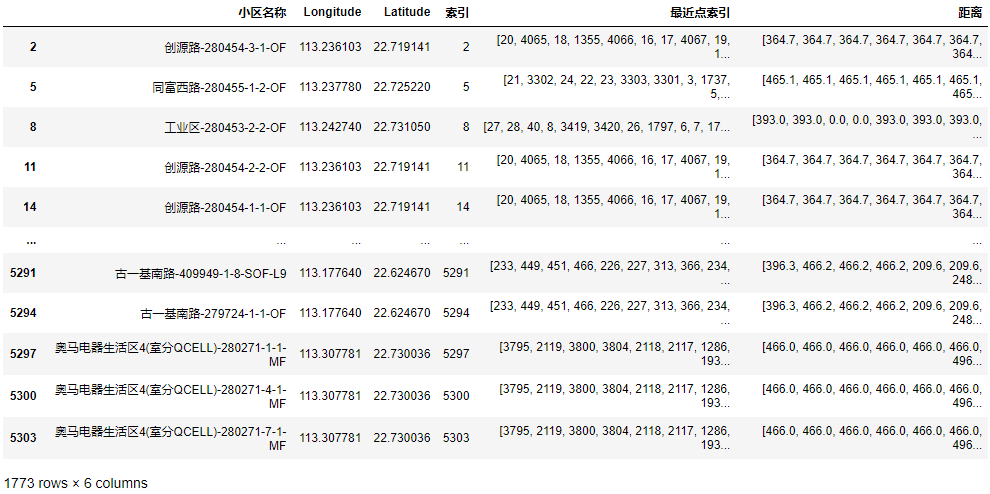
find["最近点索引"] = points.tolist()
find["距离"] = distances.tolist()
find
下面我通过folium地图可视化看看查找效果:
folium地图可视化展示
同样,随机选140个点,查看查找效果:
import folium
import itertools
from folium import plugins
m = folium.Map(location=[data.Latitude.median(), data.Longitude.median()],
zoom_start=12, zoom_control='False', control_scale=True,
tiles='http://webrd02.is.autonavi.com/appmaptile?lang=zh_cn&size=1&scale=1&style=8&x={x}&y={y}&z={z}',
attr='© <a href="http://ditu.amap.com/">高德地图</a>'
)
# 为地图对象添加点击显示经纬度的子功能
# m = m.add_child(folium.LatLngPopup())
incidents = folium.map.FeatureGroup()
for p in data.values[:, [3, 2]]:
incidents.add_child(
folium.CircleMarker( # CircleMarker表示画圆
p.tolist(), # 坐标
radius=1, # 圆圈半径
color='grey', # 标志的外圈颜色
)
)
colors_iter = iter(colors)
for name1, y1, x1, i, ps, ds in find.sample(140).values:
# 对于每个被查找的点画一个500米范围的圆
incidents.add_child(
folium.Circle(
(x1, y1),
radius=500,
color='blue',
tooltip=name1,
)
)
color = next(colors_iter)
for (name2, y2, x2), d in zip(data.loc[ps].values[:, 1:], ds):
incidents.add_child(
folium.CircleMarker( # CircleMarker表示画圆
(x2, y2),
radius=3,
color=color,
tooltip=f"{name2}\n距离\n{name1}\r{d:.2f}米",
fill=True, # 是否填充
fill_color=color, # 填充颜色
fill_opacity=1 # 填充透明度
)
)
incidents.add_child(
folium.CircleMarker( # CircleMarker表示画圆
(x1, y1), # 坐标
radius=1, # 圆圈半径
color='red', # 标志的外圈颜色
tooltip=name1,
)
)
m.add_child(incidents)
m

放大再看看:
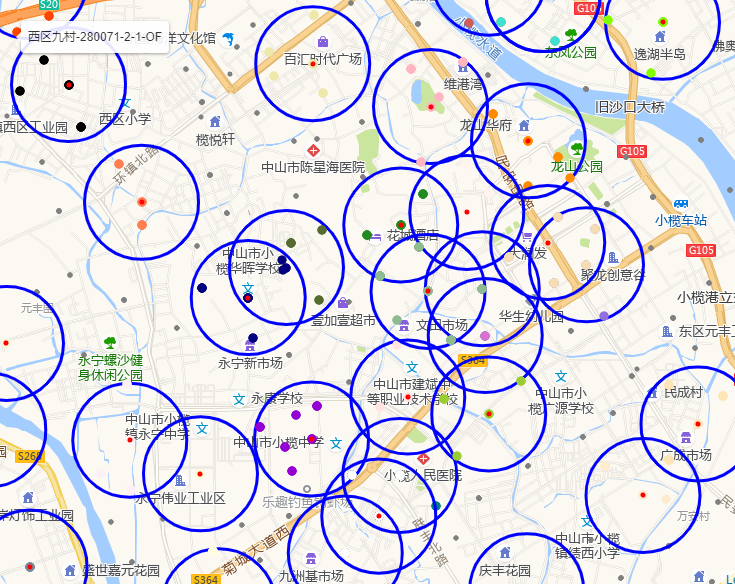
经过几轮检查,可以发现被找到的点都在蓝色圆的范围内。证明我们使用BallTree模型找到的点都有效。
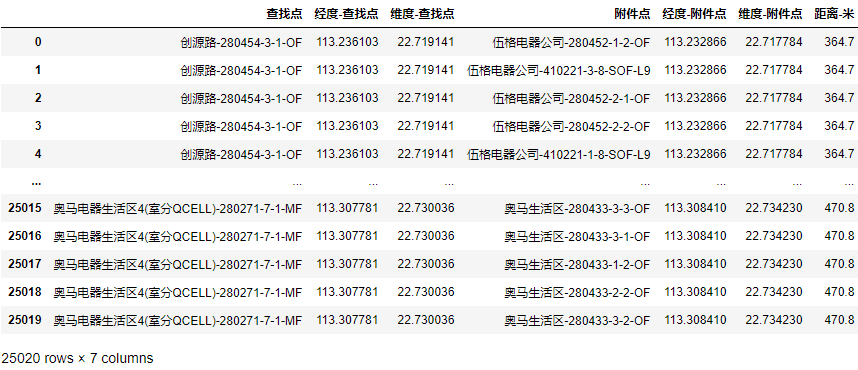
下面将结果整理成需求1一样的结果形式:
结果整理
result = []
for name1, y1, x1, i, ps, ds in find.values:
    ps, ds = ps.tolist(), ds.tolist()
    try:
        idx = ps.index(i)
    except ValueError:
        idx = -1
    if idx > 0:
        ps.pop(idx)
        ds.pop(idx)
    for p, d in zip(ps, ds):
        name2, y2, x2 = data.loc[p].values[1:4]
        result.append((name1, y1, x1, name2, y2, x2, d))
result = pd.DataFrame(result, columns=["查找点", "经度-查找点",
                                       "维度-查找点", "附件点", "经度-附件点", "维度-附件点", "距离-米"])
result
需求2整体代码
from sklearn.neighbors import BallTree
from math import *
import pandas as pd

# 数据预处理
excel = pd.io.excel.ExcelFile("point.xlsx")
find = excel.parse("查找")
data = excel.parse("数据库")
# 去除重复数据
find.drop_duplicates(ignore_index=True, inplace=True)
data.drop_duplicates(ignore_index=True, inplace=True)
data.reset_index(drop=False, inplace=True)

data.rename(columns={"index": "索引"}, inplace=True)
find = pd.merge(find, data, how="left")
find.index = data.index[data.小区名称.isin(find.小区名称)]
data_p = data.values[:, 2:4]
find_p = find.values[:, 1:3]


def distancefuc(s1, s2):
    "创建用于计算两个经纬度距离的函数"
    # 经纬度转换成弧度
    lon1, lat1 = map(radians, s1)
    lon2, lat2 = map(radians, s2)
    dlon = lon2 - lon1
    dlat = lat2 - lat1
    a = sin(dlat / 2)**2 + cos(lat1) * cos(lat2) * sin(dlon / 2)**2
    distance = round(2 * asin(sqrt(a)) * 6371000, 1)  # 地球平均半径,6371km
    return distance


bt = BallTree(data_p, metric=distancefuc)
points, distances = bt.query_radius(find_p, 500, return_distance=True)
find["最近点索引"] = points.tolist()
find["距离"] = distances.tolist()
result = []
for name1, y1, x1, i, ps, ds in find.values:
    ps, ds = ps.tolist(), ds.tolist()
    try:
        idx = ps.index(i)
    except ValueError:
        idx = -1
    if idx > 0:
        ps.pop(idx)
        ds.pop(idx)
    for p, d in zip(ps, ds):
        name2, y2, x2 = data.loc[p].values[1:4]
        result.append((name1, y1, x1, name2, y2, x2, d))
result = pd.DataFrame(result, columns=["查找点", "经度-查找点",
                                       "维度-查找点", "附件点", "经度-附件点", "维度-附件点", "距离-米"])
聚类距离小于N米的点
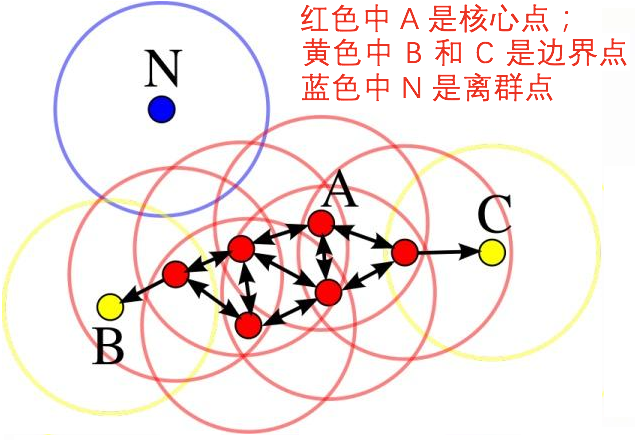
DBSCAN(Density-Based Spatial Clustering of Applications with Noise,具有噪声的基于密度的聚类方法)是一种基于密度的空间聚类算法。 该算法将具有足够密度的区域划分为簇,并在具有噪声的空间数据库中发现任意形状的簇,它将簇定义为密度相连的点的最大集合。
数据预处理
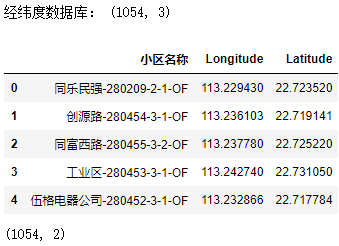
为了减少无效计算,并方便可视化,下面先将经纬度数据库中经纬度完全相同的基站去重:
excel = pd.io.excel.ExcelFile("point.xlsx")
data = excel.parse("数据库")
# 去除经纬度的重复数据
data.drop_duplicates(subset=["Longitude", "Latitude"],
                     ignore_index=True, inplace=True)
print("经纬度数据库:", data.shape)
display(data.head())
data_p = data.values[:, 1:]
print(data_p.shape)
下面我们的需求是将半径500米范围内的基站都归为一类:
from sklearn.cluster import DBSCAN

db = DBSCAN(eps=500, min_samples=1, metric=distancefuc, algorithm='ball_tree')
# 调用DBSCAN方法进行训练,labels为每个数据的类别标签
labels = db.fit_predict(data_p)
data["类别"] = labels
data["类别数量"] = data.groupby("类别")["小区名称"].transform("count")
data
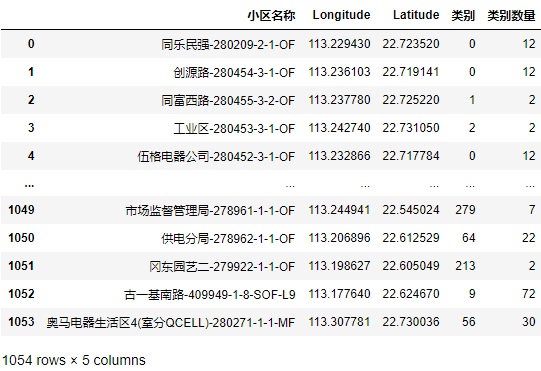
至此通过密度聚类算法DBSCAN已经将距离小于500米的基站分到同一类,给了一个唯一的类别标签。
计算每个类别下的最大距离
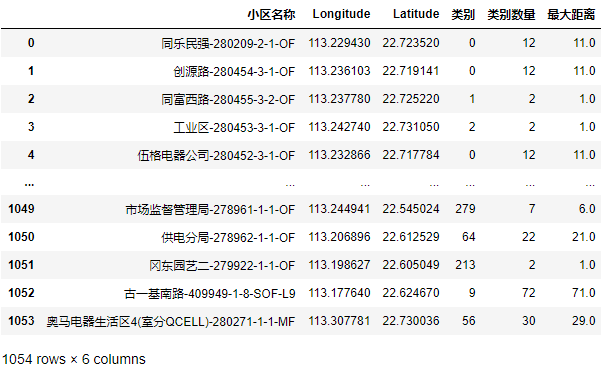
下面,计算一下每个类别下所有基站之间的最大距离:
t = pd.Series(index=data.index)
for i, df_split in data.groupby("类别"):
    ps = df_split[["Longitude", "Latitude"]].values
    bt = BallTree(ps, metric=distancefuc)
    k = len(ps)
    _, ds = bt.query(ps, k)
    t.loc[df_split.index] = ds.max()
data["最大距离"] = t
data
可视化聚类效果
import folium
import itertools
from folium import plugins
m = folium.Map(location=[data.Latitude.median(), data.Longitude.median()],
zoom_start=12, zoom_control='False', control_scale=True,
tiles='http://webrd02.is.autonavi.com/appmaptile?lang=zh_cn&size=1&scale=1&style=8&x={x}&y={y}&z={z}',
attr='© <a href="http://ditu.amap.com/">高德地图</a>'
)
# 为地图对象添加点击显示经纬度的子功能
m = m.add_child(folium.LatLngPopup())
incidents = folium.map.FeatureGroup()
colors_iter = itertools.cycle(colors)
for i, df_split in data.groupby("类别"):
color = next(colors_iter)
for name, y, x in df_split.values[:, :3]:
incidents.add_child(
folium.Circle(
(x, y),
radius=500,
color=color,
tooltip=name,
)
)
incidents.add_child(
folium.CircleMarker(
(x, y),
radius=1,
color='red',
)
)
m.add_child(incidents)
m
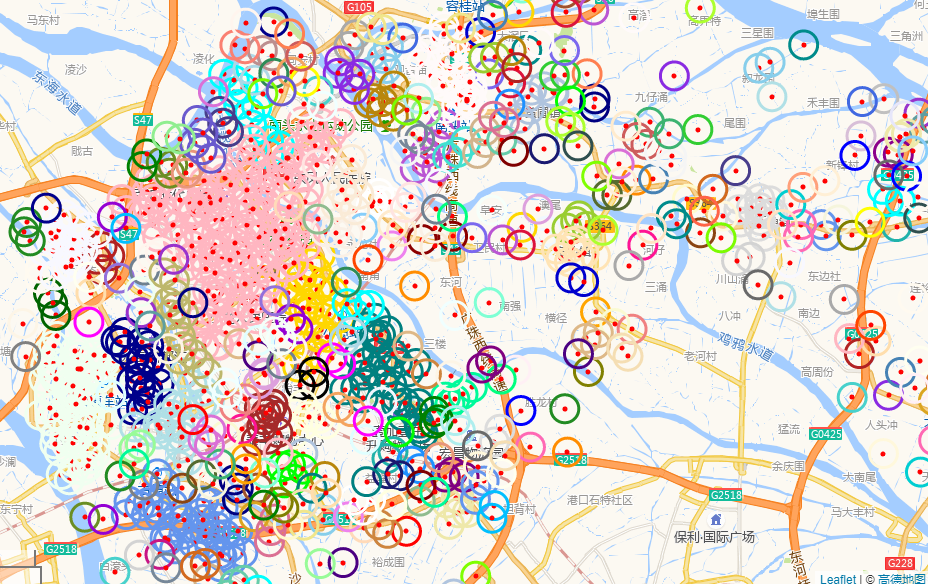
任意选个位置放大看看:
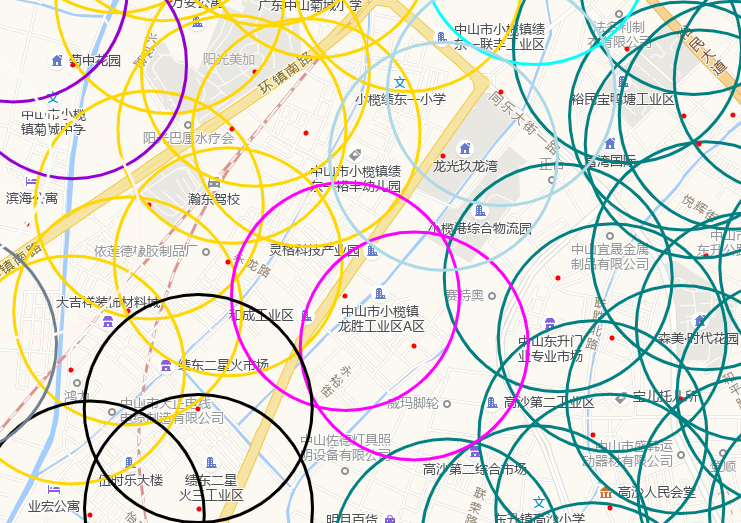
需求3数据处理整体代码
from math import *
from sklearn.cluster import DBSCAN
import pandas as pd
from sklearn.neighbors import BallTree

data = pd.read_excel("point.xlsx", "数据库")
# 去除经纬度的重复数据
data.drop_duplicates(subset=["Longitude", "Latitude"],
                     ignore_index=True, inplace=True)
print("经纬度数据库:", data.shape)
data_p = data.values[:, 1:]


def distancefuc(s1, s2):
    "创建用于计算两个经纬度距离的函数"
    # 经纬度转换成弧度
    lon1, lat1 = map(radians, s1)
    lon2, lat2 = map(radians, s2)
    dlon = lon2 - lon1
    dlat = lat2 - lat1
    a = sin(dlat / 2)**2 + cos(lat1) * cos(lat2) * sin(dlon / 2)**2
    distance = round(2 * asin(sqrt(a)) * 6371000, 1)  # 地球平均半径,6371km
    return distance


db = DBSCAN(eps=500, min_samples=1, metric=distancefuc, algorithm='ball_tree')
# 调用DBSCAN方法进行训练,labels为每个数据的类别标签
labels = db.fit_predict(data_p)
data["类别"] = labels
data["类别数量"] = data.groupby("类别")["小区名称"].transform("count")
t = pd.Series(index=data.index)
for i, df_split in data.groupby("类别"):
    ps = df_split[["Longitude", "Latitude"]].values
    bt = BallTree(ps, metric=distancefuc)
    k = len(ps)
    _, ds = bt.query(ps, k)
    t.loc[df_split.index] = ds.max()
data["最大距离"] = t